BESTNET AS current status

This company's branding has already reached 16,399 peopleand his is followed by 182 Storybook users.On average, the company has been rated 4.6 points.and commented 65 times.
Activity report 2022
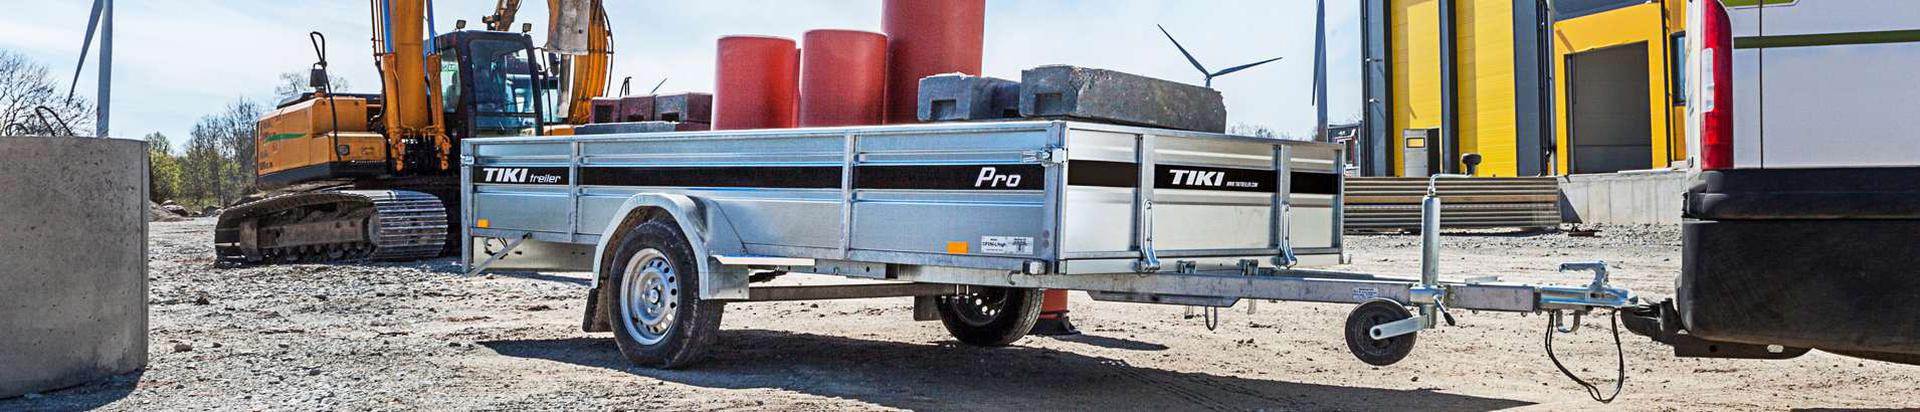
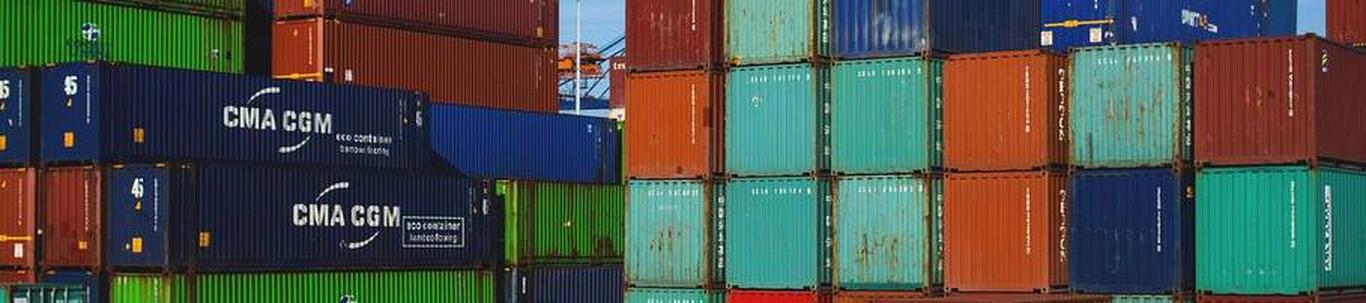
In 2022, the two main activities of the Bestnet Group were the production of trailers with a total mass of up to 3500 kg and sales in various markets, as well as the provision of various surface coating services for metal structures. The Bestnet Group is part of the B2G Group, which belongs to the AVH Group. The structure of the companies included in the consolidation group is shown in Annex 5 of the report.
The companies of the group use world-class technology, the key features of which are efficient energy and process consumable usage, a safe working environment, and high environmental friendliness. The quality and environmental management of the group's manufacturing companies are certified according to ISO 9001 and ISO 14001 standards. Companies dealing with surface coatings are holders of an environmental complex permit in accordance with the IPPC directive valid in the European Union. We are also a member of the Estonian Chamber of Commerce and Industry and the Estonian Association of Machinery Industry.
There is some seasonality in the group's activities. Both in trailer production and in the provision of surface coating services, demand increases significantly in spring and autumn, when activity in the construction sector picks up, the summer and winter seasons are noticeably calmer. The biggest influencer of the 2022 results was the Russian-Ukrainian war and inflation. The war caused disruptions in raw material supply and price stability. In addition, rapid inflation and increasing interest rates due to changes in Euribor significantly reduced customers' purchasing power in the second half of the year. The group is aware of the risks associated with its activities and has assessed their mitigation possibilities. A significant operational risk in the provision of surface coating services is the large fluctuation in the world market prices of raw materials (mainly zinc). Hedging of zinc prices has been considered, which has not been done at the moment, because the quantities used are not so large that it would justify itself. The risks associated with currency exchange rate changes (SEK and NOK) have also been assessed and it has been found that the proportion of transactions made in foreign currency is low and the risk arising from exchange rate changes is not significant enough to hedge it separately.
The economic results of 2022 were below expectations, but still good. The cash flows from the group's daily economic activities cover current expenses, in addition, the cash flows from business activities and the result of the main activity were positive during the reporting period. In the opinion of the management, a similar trend will continue in the future.
In 2022, the visual presentation of the companies belonging to the Bestnet Group, including company logos and websites, was unified and updated.
As a result of the above, the management is of the opinion that the company does not have liquidity problems as of the balance sheet date.
There were no significant environmental and social impacts associated with the group's activities.
Main financial indicators of the group: 2022 2021
Sales revenue 29 539 942 29 087 978
Revenue growth (%) 1.55 28.91
Operating profit margin (%) 6.50 12.69
Net profit (-loss) 1 874 470 3 731 135
Net profit margin (%) 6.35 12.83
Short-term obligations coverage ratio 4.30 4.36
ROA 4.98 14.73
ROE 10.01 18.53
Formulas used in the calculation of ratios:
Revenue growth (%) = (sales revenue 2022 - sales revenue 2021)/ sales revenue 2021 * 100
Operating profit margin (%) = operating profit/sales revenue * 100
Net profitability (%) = net profit/ sales revenue * 100
Short-term obligations coverage ratio (times) = current assets/short-term obligations
ROA (%) = net profit/ total assets * 100
ROE (%) = net profit/ total equity * 100
Comments (0)