RGB BALTIC OÜ current status
This company's branding has already reached 9,142 peopleand his is followed by 70 Storybook users.On average, the company has been rated 4.6 points.and commented 67 times.
Strategic decision: No desire to increase customer baseBoard member Peeter Randväli (28.11.2024): "We focus only on providing high-quality service to existing customers and maintaining relationships. We do not plan to increase our customer base."
's activity report 2022
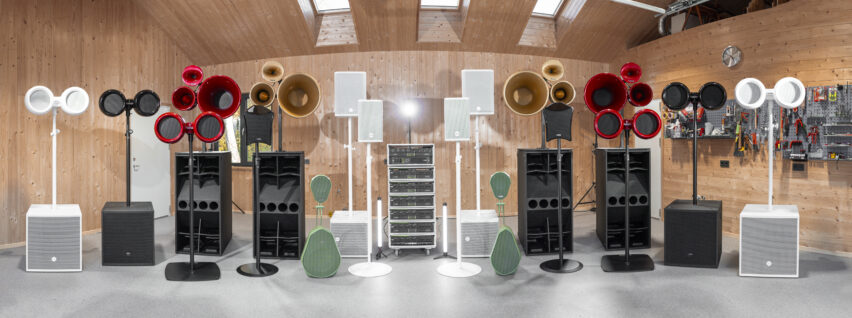
RGB Baltic is a company based on 100% Estonian capital, established in 2005. The main activity of the company is the provision of technical solutions and services for corporate events, conferences, concerts and other events.
The sales revenue for the reporting period was 7,519 thousand euros (2021 4,727 thousand euros), the sales revenue growth was 59.07% (2021 39.06%), the profit for the period was 757 thousand euros (2021 519 thousand euros).
During the reporting period, 1.3 million euros (2021 779 thousand euros) were invested in fixed assets.
In 2022, the company had 43-47 full-time employees (2021 40-43 employees), the wage cost including temporary contract workers was 1,938 thousand euros (2021 1,368 thousand euros), including the cost of board members' salaries was 120 thousand euros (2021 86 thousand euros).
Goals for the next fiscal year
The company plans to continue expanding its activities in the current field. The goal for 2023 is to cope with the war in Ukraine that broke out on 24.02.2022 and its consequences, and to continue to provide high-level technical solutions in Estonia and neighboring countries.
In the first half of 2022, the company acquired Gearmarket OÜ, which deals with the sale of used professional equipment in Europe and elsewhere in the world. The goal is to further expand the company's field of activity.
Financial ratios for the financial year and the previous financial year:
Year 2022 2021
Revenue growth 59.076% 39.06%
Operating profit amount 11% 11%
Profit growth 45.78% 291.98%
Net profitability 10.07% 11%
Short-term liabilities coverage ratio 1.09 0.9
ROA 14.93% 10.35%
ROE 21.19% 18.12%
Formulas used in calculating ratios:
Revenue growth (%) = (sales revenue 2022-sales revenue 2021)/ sales revenue 2020 x 100
Operating profit amount (%) = operating profit / sales revenue x 100
Profit growth (%) = ( net profit 2022- net profit 2021) / net profit 2021 x 100
Net profitability (%) = net profit / sales revenue x 100
Short-term liabilities coverage ratio ( times ) = current assets / short-term liabilities
ROA (%) = net profit / total assets x 100
ROE (%) = net profit / total equity x 100


Comments (0)