
GOLDBERGER OÜ current status

This company's branding has already reached 31,744 peopleand his is followed by 21 Storybook users.On average, the company has been rated 4.8 points.but there is no comment.
Activity report 2022
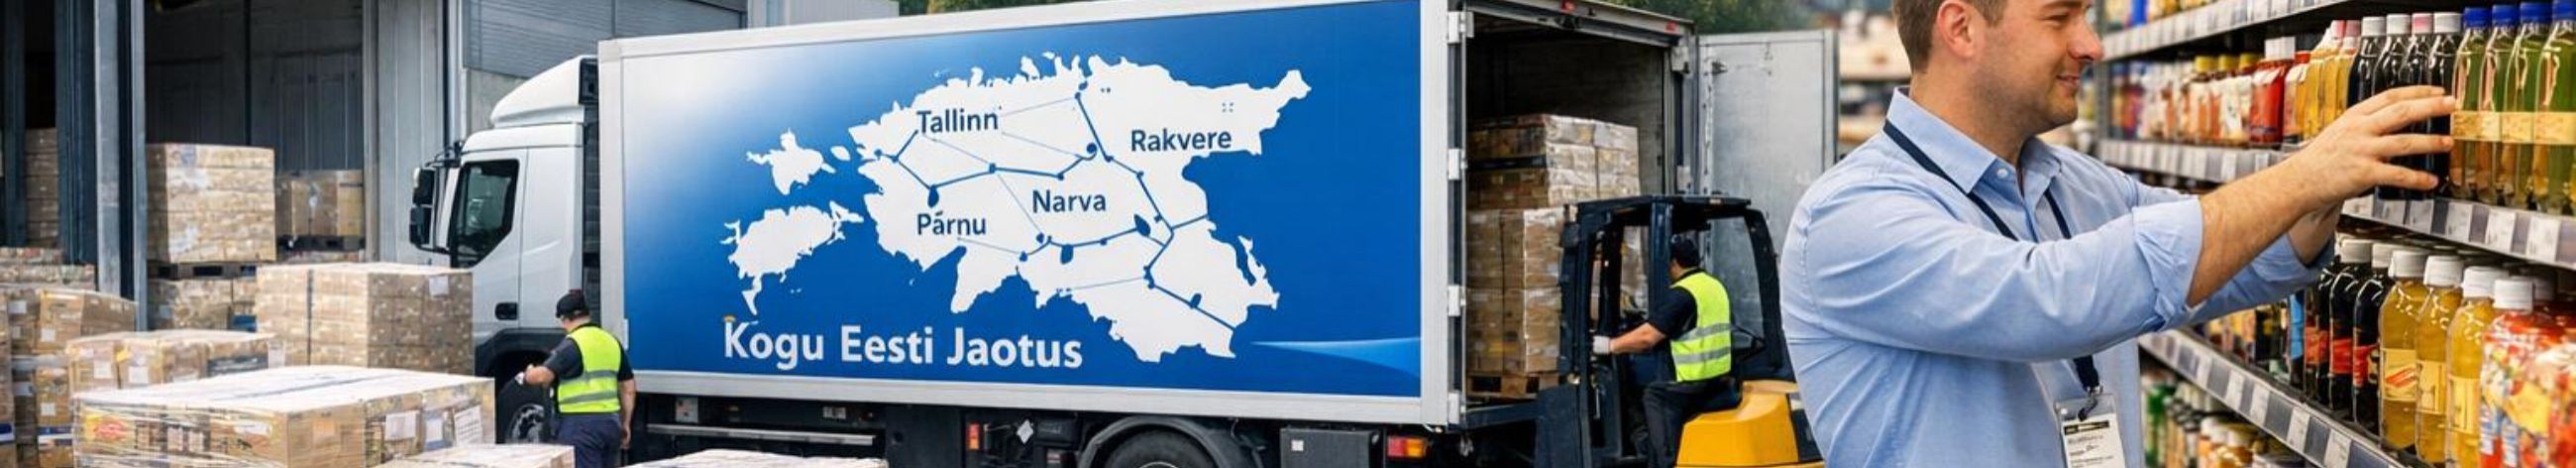
Goldberger OÜ has been operating since 2009 as an Estonian capital-based company engaged in the import, sale and marketing of food and fast-moving consumer goods (FMCG). We offer our partners a customer-based sales, marketing, logistics and product placement service. Our partners are manufacturers and importers of food and fast-moving consumer goods. Customers are primarily companies operating in retail and wholesale trade in Estonia, from large retail chains to small shops, and restaurants and bars. Sales revenue is divided 95% in Estonia and 5% among clients in other European Union countries.
2022 sales revenue of 11,940 thousand euros increased by 17.4% (2021: 10,168). The optimization of the product range and the improvement of service quality continues.
The main objectives for 2023 are:
Stable and profitable growth in sales volumes;
Optimization of the product range;
Addition of new international partners;
Continued improvement in service quality;
Team development,
Providing a targeted and motivating work environment;
Development of e-services.
We forecast a profit of 450 thousand euros for the company in 2023.
Management fees: In 2022, a fee of 9,970 euros was paid to the board member (2021: 9,970) Employee salaries: 878,474 euros, of which social tax 232,183 euros. For comparison, the corresponding figures in 2021 were 803,077 and 206,426 euros. The average number of employees as of December 31, 2022 was 38 people (December 31, 2021: 40).
Main financial ratios 2022 2021
Sales growth (%) = (sales revenue 2022 - sales revenue 2021)/ sales revenue 2021 * 100 17.42 -5.72
Gross profit margin (%) = gross profit/sales revenue * 100 17.13 16.39
Profit growth (%) = 45.03 -24.55 (net profit 2022 - net profit 2021)/ net profit 2021 * 100
Net profitability (%) = net profit/ sales revenue * 100 3.67 2.97
Short-term obligation coverage ratio (times) = 2.30 2.35 current assets/short-term obligations
ROA (%) = net profit/ total assets * 100 10.80 8.21
ROE (%) = net profit/ total equity * 100 17.98 14.26
Jarek Koppel
Manager


Comments (0)