
KOHIMO AS
Media page and news feed
?
Business media page visits - 8486; followers - 555. Reviews - 1; Articles 2+ "Write an opinion on KOHIMO AS!"
Activity history
Company management, team and contacts
KOHIMO AS current status

This company's branding has already reached 8,486 peopleand his is followed by 555 Storybook users.On average, the company has been rated 4.3 points.and commented 18 times.
's activity report 2022
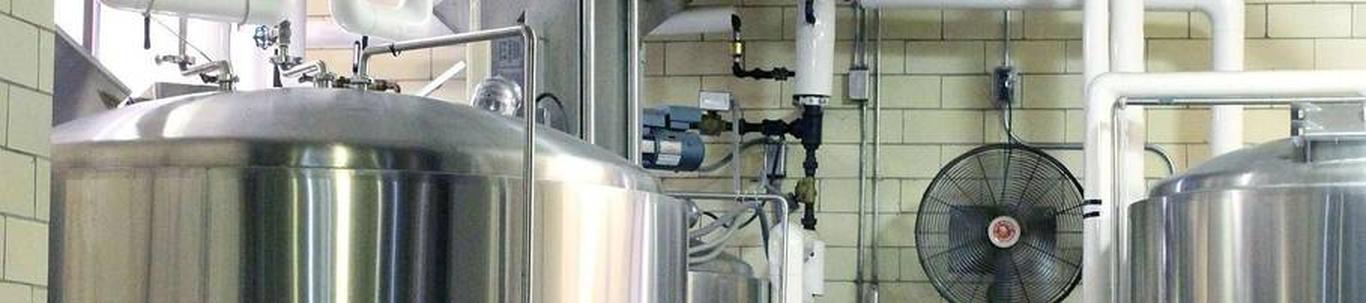
AS Kohimo's main activity is the manufacture and assembly of tanks and metal structures.
The 2022 financial year was difficult for the company. The impact of the war in Ukraine was not only a tripling of metal prices and market volatility, but also a collapse of the market in the Baltics and Scandinavia that requires larger terminals and other metal structures and tanks. In addition, the significant increase in the price of energy inputs (electricity and gas) had a significant impact.
Unfortunately, we do not foresee growth or even persistence at the previous level in Kohimo's main activity.
The management has been reprofiling the company for the manufacture of other products and/or the provision of services, but so far the efforts have not had a significant impact on the financial results.
In 2023, work will continue in the above directions, in addition to actively optimizing production and implementing cost-saving policies. Subcontracting for equipment installation and the manufacture and assembly of metal structures will be completed in the amount of 10 million euros.
To bring the equity into compliance with the law, the sole shareholder decided on 23.12.2022 to make a voluntary reserve contribution of 2,200,000 EUR, of which 120,000 was paid in 2022 and the remainder will be paid shortly. If the above is not enough to bring the equity into compliance with the law, an additional contribution will be made to the voluntary reserve capital or the share capital will be reduced.
The company does not use financial instruments to hedge financial risks.
Key financial ratios: 2022 2021
Sales revenue 7 385 311 8 572 609
Revenue growth -13.85% 43.63%
Net profit -2 269 221 -526 461
Net profitability -30.71% -6.14%
Short-term obligations 0.36 0.94 coverage ratio
ROA -114.60% -20.73%
ROE 119.48% -210.58%
Main financial ratio calculation methodology
Turnover growth(%)= (sales revenue 2022-sales revenue 2021)/ sales revenue 2021* 100
Net profitability (%)=net profit/ sales revenue *100
Short-term obligations coverage ratio(times)= current assets / short-term obligations
ROA (%)=net profit/total assets* 100
ROE (%)= net profit/total equity* 100
Cooperation partners
The company's largest partners
Add a new partner
EE- Estonia
Dropdown
File a complaint
Choose the comment attribute that you think it contains:
You want to report an inappropriate comment.
Are you sure?
Are you sure you want to delete this article?