
BALTIC PACK EST AS
Media page and news feed
?
Business media page visits - 5549; followers - 24. Reviews - 24; Articles 1+ "Write an opinion on BALTIC PACK EST!"
Activity history
Company management, team and contacts

BALTIC PACK EST AS current status

This company's branding has already reached 5,549 peopleand his is followed by 24 Storybook users.On average, the company has been rated 4.3 points.and commented 20 times.
Activity report 2022
Introduction
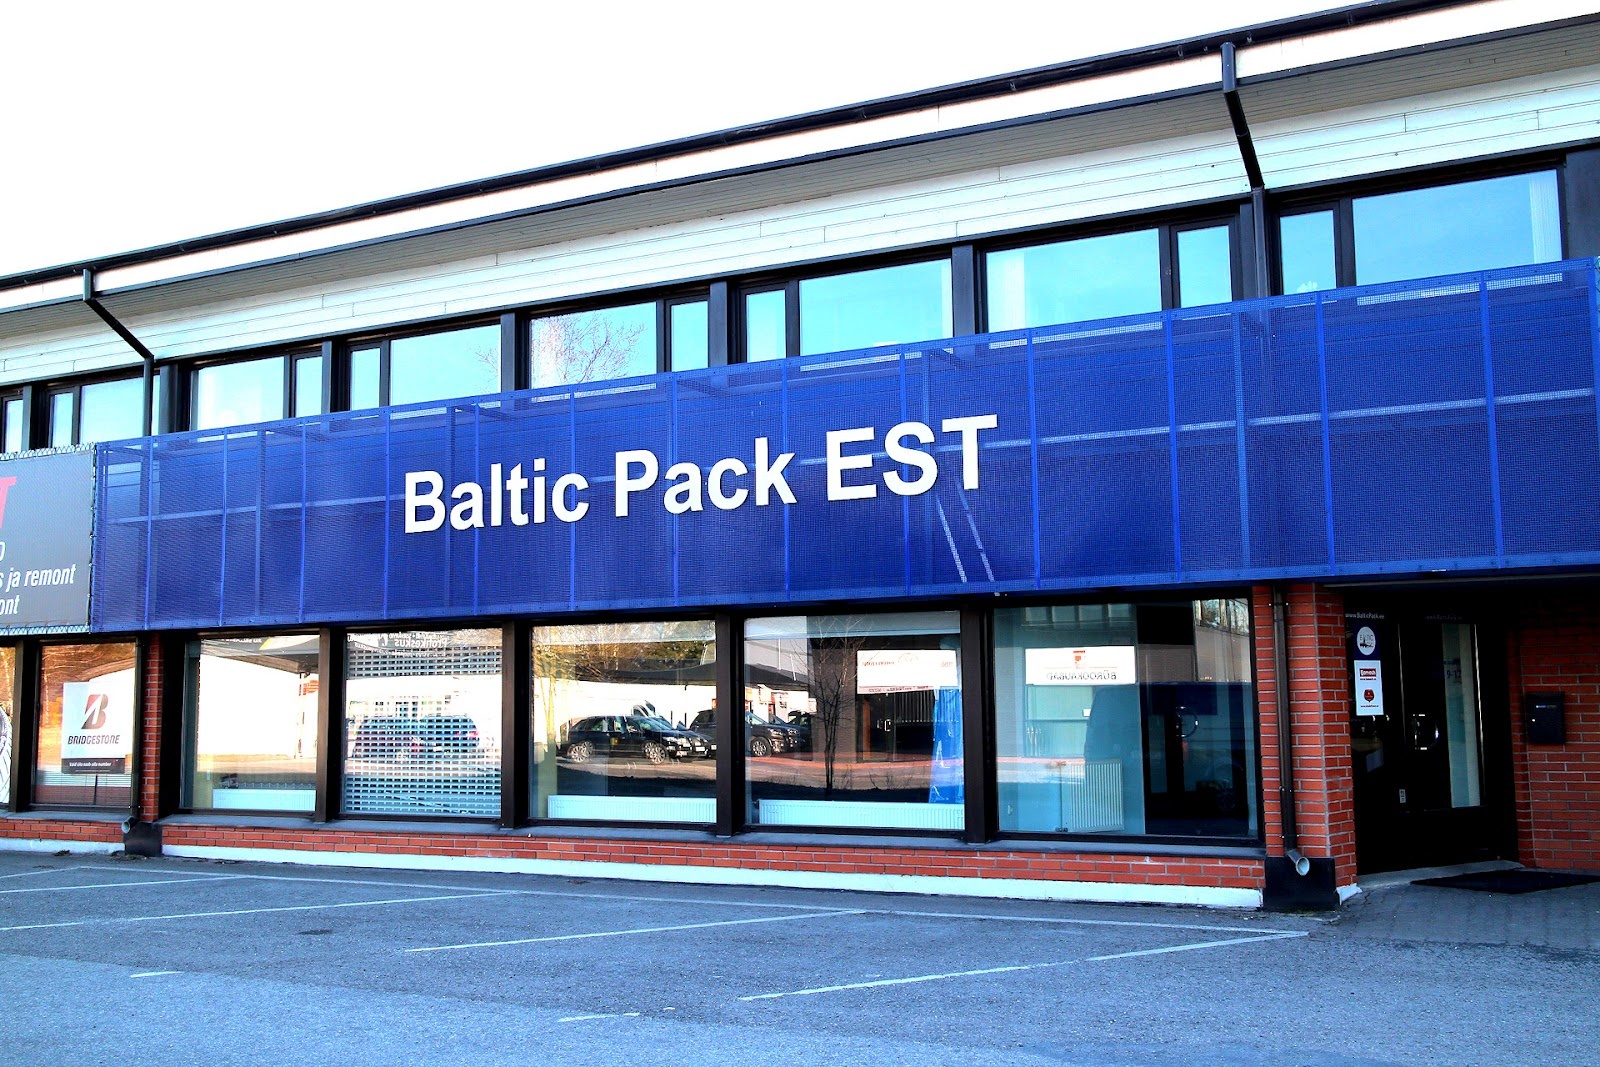
AS Baltic Pack EST's main activities are the import and wholesale of packaging materials and packages, production and packaging equipment, flavorings and additives, wines and horse feeds.
We have secured market share, developed new projects, found new customers, brought new solutions to the market and strengthened our position during the reporting year.
Revenues, expenses and profit
AS Baltic Pack Est's customers are meat, fish, bread, dairy and cheese industries, as well as commercial enterprises involved in packaging goods. In 2022, 98.06% of sales revenue was made up by Estonian companies. AS Baltic Pack Est's profit for the reporting year in 2022 amounted to 247 thousand EUROs.
The sales revenue for 2022 was 9.82 million EUROs, of which the sale of spices was 779 thousand EUROs, the sale of packaging equipment was 2.762 million EUROs, the sale of alcoholic beverages was 314 thousand EUROs, the sale of packaging materials was 5.704 million EUROs and 263 thousand EUROs of the turnover was made up by the sale of other goods and services.
Main financial ratios 2022 2021 2020
Sales revenue (EURO) 9 822 568 7 537 128 7 221 786
Profit for the year (EURO) 247 286 240 445 229 806
Equity (EURO) 3 134 176 2 987 564 2 843 479
Number of employees - Converted to full-time 17 18 18
Short-term debt coverage ratio (times) 2.48 2.28 3.08
Inventory turnover ratio (times) 4.44 3.86 4.83
Debt ratio (times) 0.31 0.35 0.29
Net sales profitability (%) 2.52 3.19 3.18
Total capital net profitability (ROA %) 5.46 5.22 5.75 7.89 8.05
Equity net profitability (ROE %) 8.08
Formulas used in calculating ratios
Short-term debt coverage ratio = current assets/short-term liabilities
Inventory turnover ratio = cost of goods sold/average inventory
Debt ratio = liabilities/total liabilities
Net sales profitability = net profit/sales revenue x 100
Total capital net profitability (ROA) = net profit/assets x 100
Equity net profitability (ROE) = net profit/equity x 100
Risk of exchange rate changes
Transactions with suppliers and customers take place in over 99% in EUROs, therefore there is a currency exchange risk
BALTIC PACK EST AS contacts
Cooperation partners
The company's largest partners
Add a new partner
EE- Estonia


Dropdown
File a complaint
Choose the comment attribute that you think it contains:
You want to report an inappropriate comment.
Are you sure?
Are you sure you want to delete this article?