HIIU KALUR AS current status

This company's branding has already reached 11,627 peopleand his is followed by 114 Storybook users.On average, the company has been rated 5.0 points.but there is no comment.
Activity report 2022
AS Hiiu Kalur (formerly known as AS Dagomar) was established in 1992. In 2008, AS Dagomar merged with its parent company AS Hiiu Kalur and its subsidiary OÜ Kaleste, where AS Dagomar was the merging entity and AS Hiiu Kalur and OÜ Kaleste were the entities being merged. After the merger, AS Dagomar continued to operate under the business name AS Hiiu Kalur.
AS Hiiu Kalur is a subsidiary of AS Direct Consulting.
AS Hiiu Kalur had 5 fishing vessels in 2022 and currently has 5 fishing vessels.
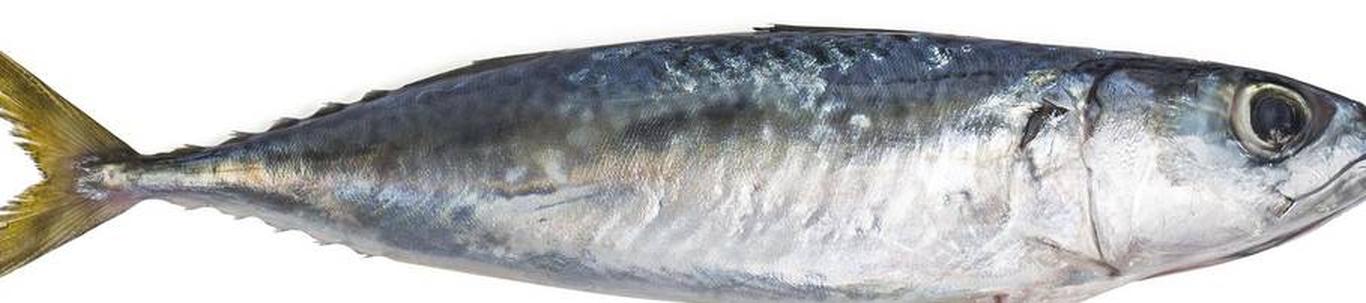
The main activity of AS Hiiu Kalur is sprat and herring fishing in the Baltic Sea (EMTAK 03111). The same activity will continue in 2023.
in the financial year.
In 2022, a total of 11,578.9 (2021:11,842.3) tons of fish were caught, including 7,508.8 (2021: 8,164.5) tons of herring, 4,068.8 (2021: 3,676.6) tons of sprat and other fish 1.3 (2021: 1.2) tons.
Revenues, expenses and profit In 2022, AS Hiiu Kalur's sales revenue was 3.78 (2021: 3.21) million euros. Sales revenue consisted of 97.6% (2021: 92.7%) of fish catch
in the Baltic Sea. The importance of export in sales revenue was 0.6% (2021: 2.5%).
The company ended the 2022 financial year with a profit of 0.8 million euros.
Investments
A total of 389.5 thousand euros was invested in tangible fixed assets and 170.0 thousand euros in intangible fixed assets. In 2023, it is planned to invest 250 thousand euros.
As of 31.12.2022, AS Hiiu Kalur had a 50% stake in AS Läätsa Kalatööstus and OÜ Soome Kala, AS Kajax Fishexport and AS
Krapesk has a 40% stake, OÜ Traaler has a 33% stake and Eesti Kalapüügiühistus has a 20% stake.
Financial ratios 2022 2021
Turnover growth/decline compared to the previous year 17.8% -4.6%
General level of solvency 4.0 2.9
Liquidity ratio 3.6 2.6
Net profit margin 21.77% 32.76%
Operating profit margin 15.17% 16.67%
Return on assets (ROA) 5.59% 7.00%
Return on equity (ROE) 8.14% 11.45%
Turnover growth compared to the previous year=((sales revenue/previous year's sales revenue)-1*100)
General level of solvency=current assets/short-term liabilities
Liquidity ratio=(current assets-inventory)/short-term liabilities
Net profit margin (%)=net profit/sales revenue*100
Operating profit margin(%)=operating profit/sales revenue*100
Return on assets (ROA)=net profit/total assets on average*100
Return on equity (ROE)=net profit/total equity on average*100

Comments (0)